Fisher Information
Fisher Information Heading link
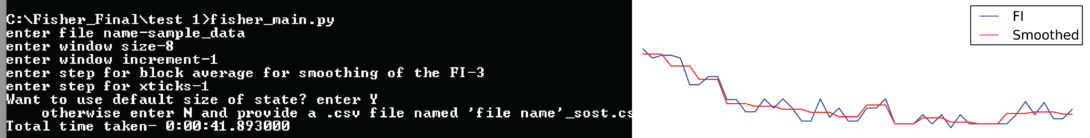
Fisher information offers a robust method to assess the stability of a system over time. It is essentially able to compile multiple variables that each capture different aspects of a system, and outputs a global indicator of stability. We have coded a Fisher Information (FI) tool to automatically calculate a plot Fisher information for any timeseries data. The code can be downloaded by itself below or directly from GitHub. We have versions for both Python 2 and 3. We have also made available a tutorial with a simple numerical example. For citation and details about the method, please see Ahmad, N., Derrible, S., Eason, T., Cabezas, H., (2016) Using Fisher information to track stability in multivariate systems, Royal Society Open Science, 3:160582; DOI: 10.1098/rsos.160582, available here. See our publication page for full details.
version 2.00: GitHub | Download | Tutorial | Publication (Python 3)
version 1.00: GitHub | Download | Tutorial | Publication (Python 2)