Fisher Information of US Public Transportation Systems
Fisher Information of US Public Transportation Systems Heading link
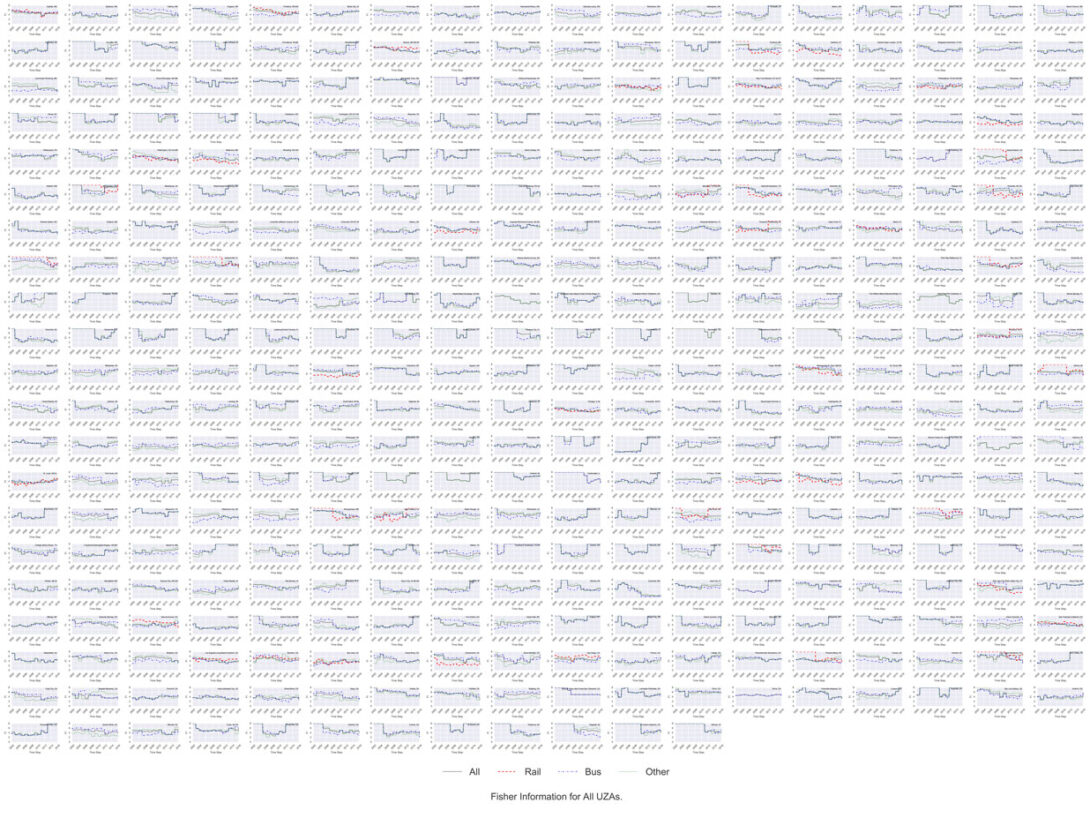
The figure below shows the stability of the 372 public transportation systems in the United States that report their data to the National Transit Database. The data used starts in January 2002 and ends in December 2016. Results were calculated per city (and not per system for cities that have multiple transit systems). We also differentiate between: all modes, rail modes, bus modes, and other modes. In other words, click on the figure to find out how your city’s transit system is performing. Stability is measured using Fisher Information (FI). FI is a mathematical technique that was adapted to measure the stability of a system that is governed by multiple variables. Here, we used both ridership and vehicle miles traveled data. The full paper is available here in open access and includes a detailed study of Atlanta, Boston, Chicago, New York City, Philadelphia, Sacramento, San Francisco, and Washington DC. To learn more about Fisher Information, see our previous publication that details the technique, and to calculate Fisher Information, download our free Python code.
Click on the picture to get the full pdf and improve the resolution.