Multi-Criteria Robustness Analysis of 33 Metro Networks
Multi-Criteria Robustness Analysis of 33 Metro Networks Heading link
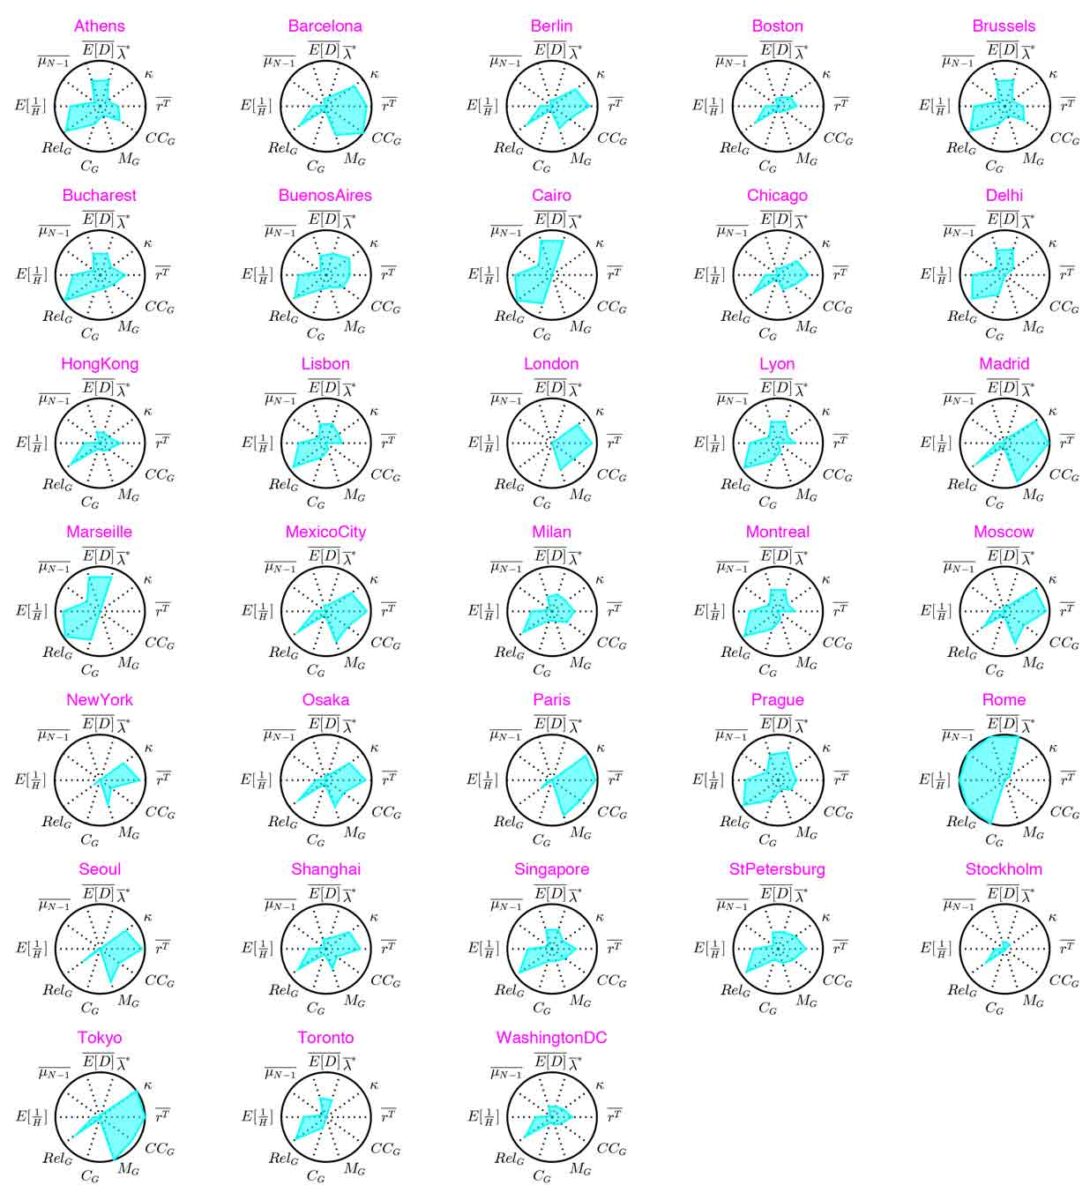
How do you assess the robustness of a system? This is far from being a trivial question since robustness can be measured in a number of different ways. In January 2017, CSUN Director Sybil Derrible and CSUN Member Nasir Ahmad published an article in Physica A: Statistical Mechanics and its Applications in which they measure the robusntess of 33 world metro networks (from this data) in 10 different ways using elements of network science. The study was lead by Xiangrong Wang (Google Scholar and LinkedIn) who recently received her Ph.D. from Robert Kooij‘s group at TU Delft (Congratulations to Xiangrong), and it includes a number of other researchers from TU Delft as well. See the full articles here and download the citation from our publications page.
Instead of coming up with one final measure that combines the 10 individual measures, we decided to plot all of them on a radar diagram (also called a spider or star diagram). Radar diagrams provide a simple and effective way to visualize the performance of systems that are expressed by multiple variables. Although the order of the measures has an impact on the area of the polygon formed, they still offer one of the best and simplest ways to visualize multiple indicators together.
Click on here or on the image for a full version of the visualization. Don’t hesitate to contact us if you would like more information about this study or if you are interested to learn more about CSUN’s research in general.