Real-Time Weather Monitoring (Current Temperature: | Relative Humidity: )
Real-Time Weather Monitoring (Current Temperature: | Relative Humidity: ) Heading link
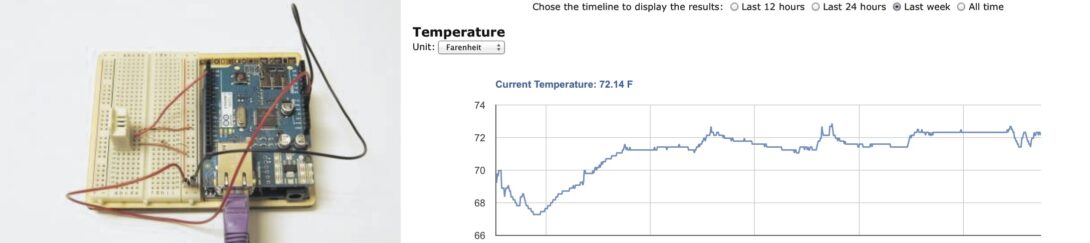
Update: the Arduino was unplugged. The data is not being uploaded and displayed in real-time anymore.
The visualization (click on the picture) displays the current and historical temperatures (in both farenheit and celsius) and relative humidities in the office of CSUN Director Sybil Derrible. Measurements are made every 10 minutes by an Arduino sensor, they are submitted to this Google Spreadsheet and then plotted using Google Charts. This was our first venture into hardware hacking. More technical details can be found below the charts in the visualization page.