Visual Analysis of a Smart City’s Energy Consumption
Visual Analysis of a Smart City’s Energy Consumption Heading link
How can we effectively visualize energy consumption in cities? You might think that the answer is trivial and that a few maps would be enough, but visualizing spatiotemporal data like energy consumption is actually very challenging.
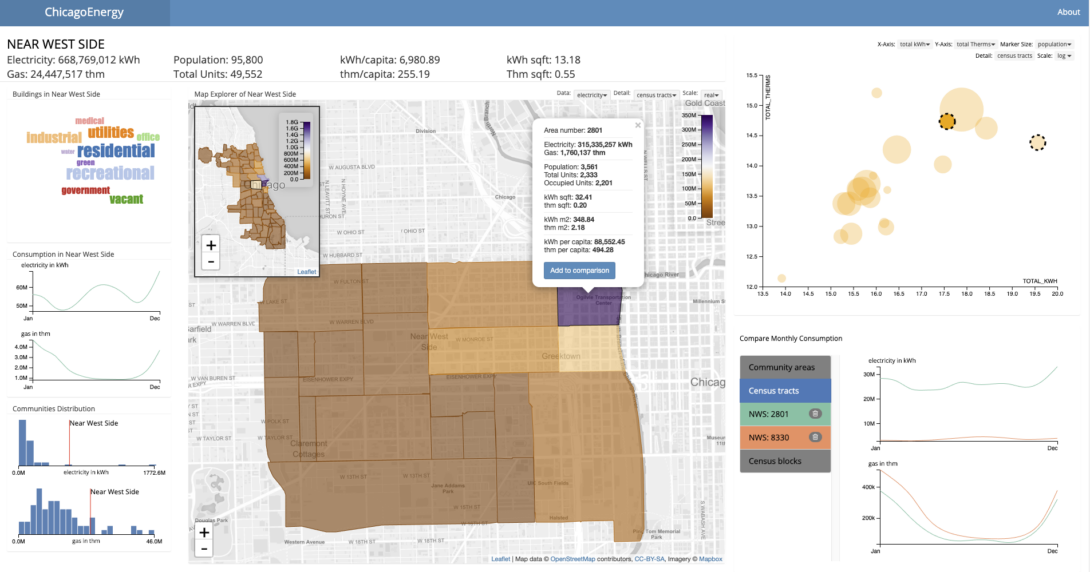
Juan Trelles Trabucco, who works at the famous Electronic Visualization Laboratory with Liz Marai at UIC, developed an interactive, web-based, open-source energy consumption explorer for the city of Chicago. The explorer displays electricity and natural gas data at the Census Block level for the city of Chicago in 2010. The data was downloaded from the City of Chicago Open Data Portal.
The explorer is available at http://chicagoenergy.evl.uic.edu:3000/ (or click on the picture). Make sure to visit it and play around with it. You can learn more about it from the About page. Feel free to contact Juan to get access to the full code if needed or to ask him any question.
To learn more about the explorer and to cite it, please see the article Visual Analysis of a Smart City’s Energy Consumption published in open access in the journal Multimodal Technologies and Interaction.