Visualizing How Topics Evolve Over Time
Visualizing How Topics Evolve Over Time Heading link
How can we capture the topics that naturally emerge from a corpus of documents? And how can we visualize the trends in how these topics evolve over time? This is what we set ourselves to do with the Literature Topic Co-occurrence and Frequency (LiTCoF) Python tool that we developed.
Using Natural Language Processing (NLP), we mined all the scientific literature that contained specific keywords related to industrial ecology and climate change. In the end, we collected more than 30,000 abstracts that you can download freely here. Then, to analyze all of this text, we developed the Literature Topic Co-occurrence and Frequency (LiTCoF) Python tool; you can download the tool freely here.
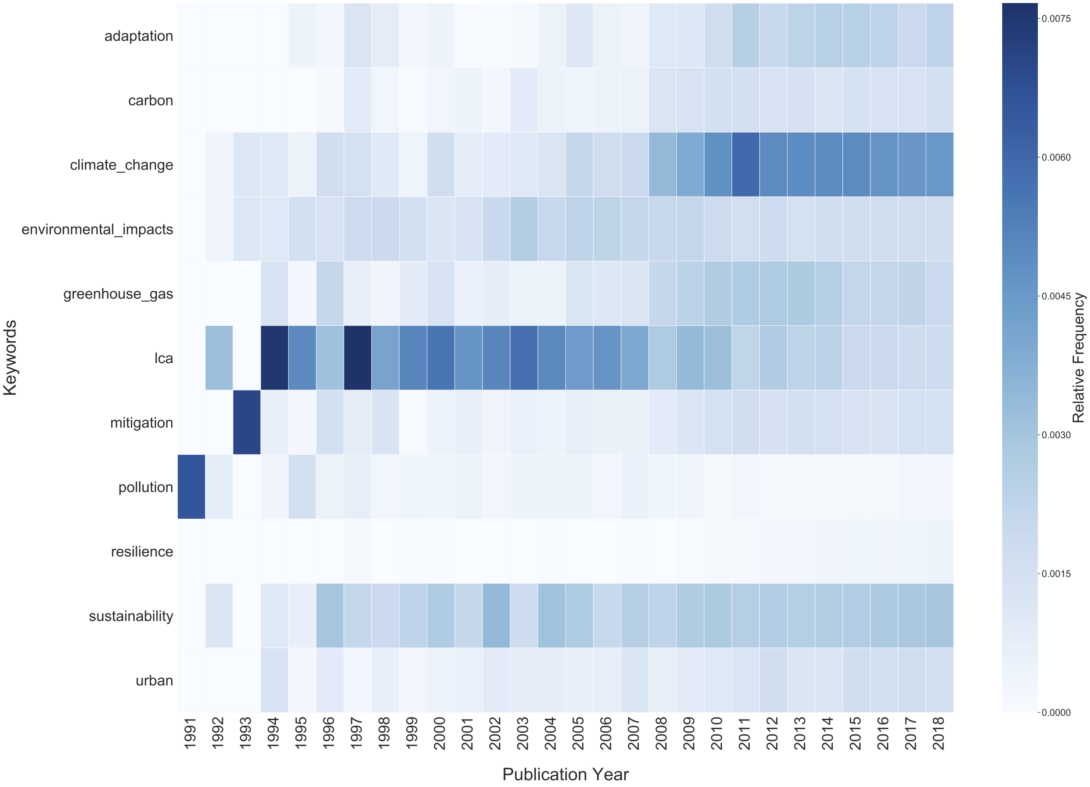
Authors themselves specify keywords, but topics also naturally emerge from an entire corpus of publications, in the form of new keywords. LiTCoF does many things and one of them is to identify and keep track of how topics evolve over time using Latent Dirichlet Allocation (LDA). To visualize the results, LiTCof plots a heatmap like the one shown below. All of our results were published in the article: Dayeen, F.R., Sharma, A.S., Derrible, S. “A text mining analysis of the climate change literature in industrial ecology”. Journal of Industrial Ecology. 2020; 24: 276– 284.
Feel free to use the tool yourself as much as you want. We just ask you to cite our paper.